Spitsbergen is an important site for its enormous numbers of arctic seabirds. Unfortunately, logistics make the island very difficult to work on. SEAPOP monitors seabirds in seven main colonies in three areas: Brünnich’s guillemots at Diabasodden (Isfjorden), Ossian Sarsfjellet (Kongsfjorden) and Alkefjellet (Hinlopen), kittiwakes at Grumantbyen (Isfjorden) and Alkefjellet (Hinlopen), little auks at Bjørndalen (Isfjorden) and Feiringfjellet (Kongsfjorden), and glaucous gulls in Kongsfjorden. Spitsbergen was included as a key site in SEAPOP in 2005, but work with kittiwakes and glaucous gulls started in 2008 and 2011 respectively, and work in Hinlopen started in 2015.
Contact person: Sébastien Descamps, Norwegian Polar Institute
Photo: Sébastien Descamps
Location and description
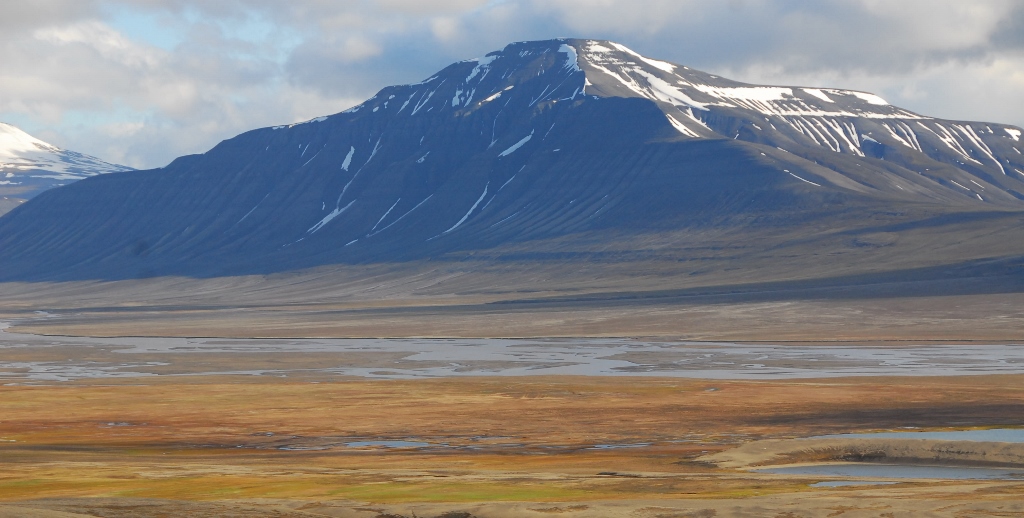
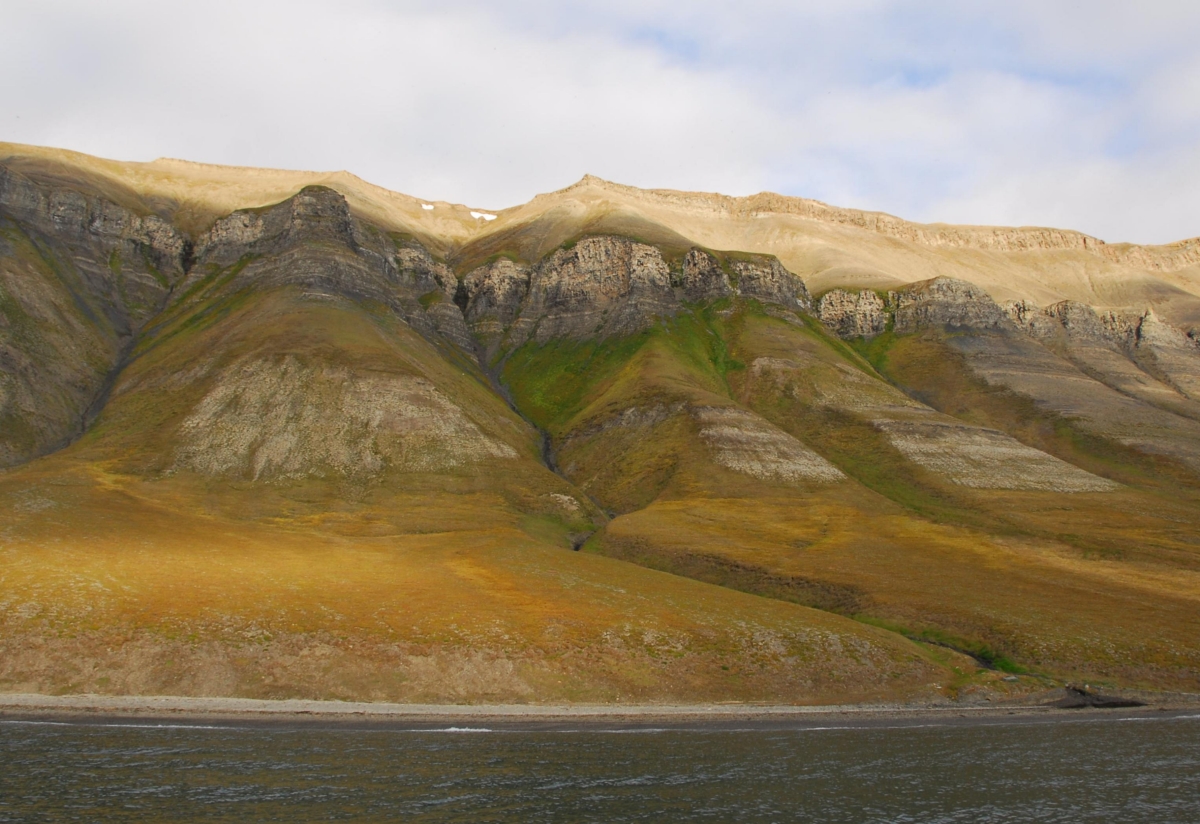
Spitsbergen is the largest island in the archipelago that forms Svalbard, and the name is derived from the Dutch words “spits” and “bergen” which translate to “pointed mountains”. The climate here is arctic, but the influence of the warm Atlantic current flowing along the west coast results in temperatures being higher than elsewhere at equivalent latitudes. The vegetation is sparse and consists mostly of moss, lichens and grass in addition to herbaceous plants near the bird colonies.
The landscape at Spitsbergen is wild and beautiful. Below the bird cliffs, grass and herbs have good growing conditions due to the natural fertilization. Photo: Sébastien Descamps
Access
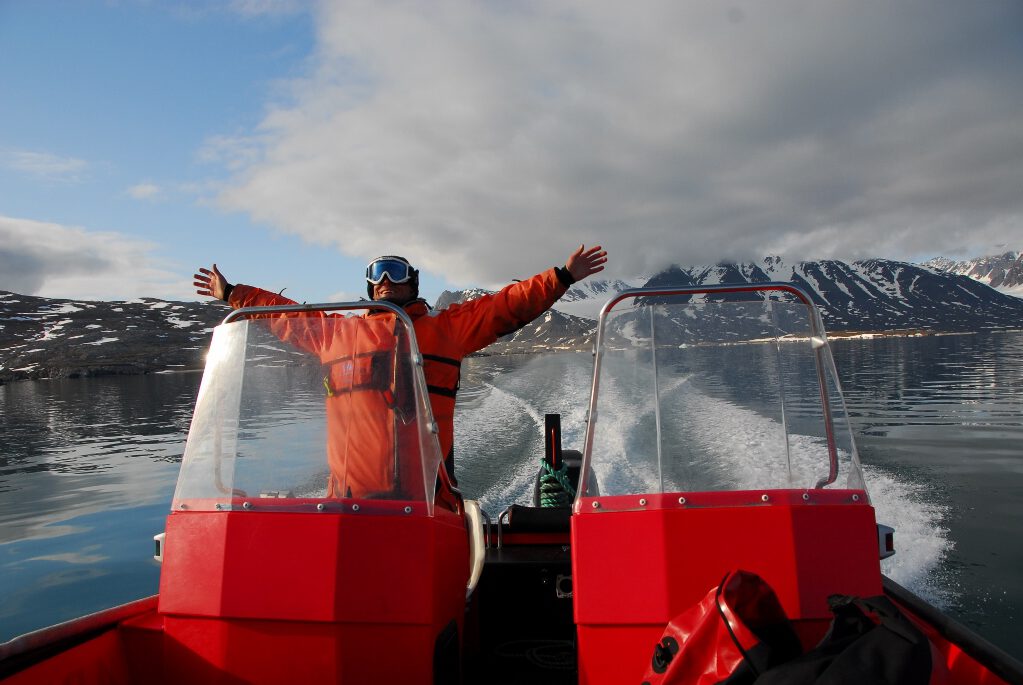
There are daily flights from mainland Norway to Longyearbyen (Isfjorden), which is the largest settlement on Spitsbergen. Weekly departures with small aircraft between Longyearbyen and Ny-Ålesund give easy access to Kongsfjorden. The seabird colonies in the two fjords are reached using a RIB or small boat. The exception is the little auk colony in Bjørndalen, which is accessible by car from Longyearbyen. Helicopter is needed to access the Alkefjellet colony in Hinlopen (East Svalbard).
One of SEAPOP’s field workers on his way to a bird colony in Kongsfjorden. Photo: Sébastien Descamps
Wildlife
Twenty-eight species of seabirds are common breeders on Svalbard, and all nest on Spitsbergen. The most numerous species are little auk Alle alle, fulmar Fulmarus glacialis, Brünnich’s guillemot Uria lomvia and kittiwake Rissa tridactyla. The main predators of seabirds on Spitsbergen are the arctic fox Vulpes lagopus and glaucous gull Larus hyperboreus. Polar bears Ursus maritimus may also take eggs from eiders Somateria mollissima and geese.
Mapping
The SEAPOP programme maps seabird populations in coastal areas and on the open sea with focus on Norway, Svalbard and Jan Mayen, as well as sea areas under Norwegian juristiction. In addition, we document the area use and migrations of the seabird populations throughout the year.
Populations along the coast
The distribution of seabirds along the coast of Norway, including Svalbard and Jan Mayen, is mapped in three periods during the year: the breeding season, the moulting period for ducks and the winter season. The goal has been to cover the whole area under Norwegian responsibility in a 10-year cycle. That is to say, that a new mapping cycle is started after ten years. All species are registered, but the focus has been on SEAPOP’s key species.
Key sites
Seabird monitoring is the most resource-demanding task in SEAPOP and encompasses annual registrations of population size, adult survival, reproduction and diet for a selection of so-called “key species” from a geographical selection of localities.
Spitsbergen
Spitsbergen is an important site for its enormous numbers of arctic seabirds. Unfortunately, logistics make the island very difficult to work on. SEAPOP monitors seabirds in seven main colonies in three areas: Brünnich’s guillemots at Diabasodden (Isfjorden), Ossian Sarsfjellet (Kongsfjorden) and Alkefjellet (Hinlopen), kittiwakes at Grumantbyen (Isfjorden) and Alkefjellet (Hinlopen), little auks at Bjørndalen (Isfjorden) and Feiringfjellet (Kongsfjorden), and glaucous gulls in Kongsfjorden. Spitsbergen was included as a key site in SEAPOP in 2005, but work with kittiwakes and glaucous gulls started in 2008 and 2011 respectively, and work in Hinlopen started in 2015.
Contact person: Sébastien Descamps, Norwegian Polar Institute
Bjørnøya
Bjørnøya is located midway between mainland Norway and Spitsbergen. The island is the southernmost point of the Svalbard archipelago, and appears as a small and isolated island in the midst of a large sea area. Seabirds occur in huge numbers on Bjørnøya, and monitoring started here in 1986.
Contact person: Hallvard Strøm, Norwegian Polar Institute
Hornøya
Hornøya is one of SEAPOP’s key locations associated with the southern Barents Sea. It is part of the Hornøya and Reinøya nature reserve that was established by the Royal Decree of 28 January 1983. Research and monitoring of seabirds have been conducted on Hornøya for many years.
Contact person: Tone Kristin Reiertsen and Kjell Einar Erikstad, NINA
Hjelmsøya
Hjelmsøya is in the north of the country, where the coastline turns eastwards and the sea is to the north and not to the west. Here, the shelf break leaves the coast, and the shallow Barents Sea extends northwards towards Bjørnøya and eastwards towards Novaja Zemlja. Cod fry, herring and saithe drift past the island from the south and into the Barents Sea – a resource taken advantage of by the seabirds. The seabirds on Hjelmsøya have been monitored since 1984.
Contact person: Geir Helge Systad, NINA
Monitoring
The foundation for all nature monitoring is the collection of time series data for different variables, and this applies also to our work following the status of our seabird populations. A time series is constructed by regularly measuring a variable over time.
Population sizes
Knowledge about the size of seabird populations is important, in part, in order to evaluate the conservation value and vulnerability of the populations. Species that occur in large numbers with a wide distribution are often more robust against negative influences than species that are few in number.
Methods
In SEAPOP, seabird colonies are mapped and monitored from land, air, and on the open sea. Below you will find general descriptions of the most important methods we use to obtain the knowledge that the programme focuses on and builds up. There is not enough space here to shed light on all the details and accompanying challenges, but those who are particularly interested will find a lot of additional information by searching in the most relevant publications. One can also approach the contact persons listed in the reviews of the different method descriptions, for further information.
Species
Learn more about the seabird species SEAPOP monitors via species-specific descriptions, distribution maps and time series data!
Causal research
SEAPOP’s monitoring data are needed to analyse which environmental variables cause observed population trends, and to make reliable predictions for the further development of the seabird populations. To understand why populations change over time, more data than just the variations in numbers are needed.
Breeding success
Tabular overview of annual breeding success (“Good”, “Moderate” or “Poor”) at various locations where the species is being monitored.
Diet
Graphic presentation of the chicks’ diet composition (what kind of prey groups the species is using as food for their young) at various years.
Ytre Oslofjord
Røst
With its large bird cliffs and unique location, Røst is a natural choice as a key site. Research on seabirds has been carried out here since the 1950s, and at Røst we find the longest monitoring series on seabirds in Norway.
Contact person: Tycho Anker-Nilssen, NINA
Anda
Anda Nature Reserve and Ramsar site is located in Øksnes municipality in Nordland, at the north end of Langøya. Anda has one of the largest Atlantic puffin colonies in Nordland. Kittiwakes, razorbills, common guillemots, black guillemots, European shags, herring gulls and great black-backed gulls also breed on the island, which has been a SEAPOP key site since 2005.
Contact person: Signe Christensen-Dalsgaard, NINA
Vestland
Measured in the number of nesting pairs, Lyngøy is the largest seabird colony in Hordaland. It has been a SEAPOP key site since 2009.
Contact person: Geir Helge Systad, NINA
Agder
Key site Agder has the island Rauna in Farsund municipality as its main locality, but also comprises several sites in Mandal municipality. These are described separately below.
Contact person: Børge Moe, NINA
Rogaland
Kjørholmane Nature Reserve in the municipality of Sola is part of the Rott-Håstein-Kjør bird protection area, which became a Ramsar site in 2011. This is an important nesting area for seabirds and resting place for seals. Because Kjørholmane has one of the largest shag colonies in Norway, the reserve was established as a SEAPOP key site in 2009 under the name “Key site Rogaland”. A little further north, just off Karmøy, is Jarsteinen, where SEATRACK has been working since 2014 with migration studies on shags and fulmars.
Contact person: Signe Christensen-Dalsgaard, NINA
Runde
Runde, located at Sunnmøre in Møre og Romsdal, is Norway’s and Scandinavia’s southernmost large bird cliff. Seabirds have been monitored here since 1959. Atlantic puffin, common guillemot, razorbill, European shag, northern gannet and great skua breed at Runde. Runde was included as a SEAPOP key site in 2007, and included the kittiwake colony in Steinvågsundet on Aspøya in Ålesund in 2011.
Contact person: Signe Christensen-Dalsgaard, NINA
Sør-Helgeland
SEAPOP’s key site at Sør-Helgeland is located on the little Horsvær archipelago in Sømna municipality. Horsvær includes seven larger islands and countless islets and skerries. The archipelago was one of the outermost settlements in the municipality, but was vacated at the end of the 1950s. One of Norway’s largest breeding site for the threatened northern race of the lesser black-backed gull can be found at Horsvær, and this site was therefore included in the National monitoring programme for seabirds in the early 1980s.
Contact person: Jan Ove Bustnes, NINA
Sklinna
Sklinna is the only seabird colony with a complete set of the common bird cliff species between Runde and Røst, and is, as such, the most important seabird colony in Central-Norway. It was therefore a natural choice as a key site. On Sklinna, seabirds have been monitored and studied annually since 1980. Sør-Gjæslingan, far south in Vikna municipality, became part of the Sklinna key site in 2011.
Contact person: Nina Dehnhard, NINA
Grindøya
Grindøya is an island in Sandnessundet, located between Tromsøya and Kvaløya and is a part of the Grindøysundet Nature Reserve. Grindøya has been a SEAPOP key site since 2009. Grindøya and the surrounding shallow areas are important foraging and breeding areas for many duck, wader and gull species. In winter, a large number of birds, especially common eider, long-tailed duck and velvet scoter, use the waters surrounding Grindøya.
Contact person: Sveinn Are Hanssen, NINA
Jan Mayen
Jan Mayen is Norway’s westernmost outpost on the borderline between the Norwegian Sea and the Greenland Sea. In 2010, the seabird colonies on Jan Mayen were surveyed, and the island was incorporated in SEAPOP as a key site in 2011. Jan Mayen is a volcanic island, also known as “Djeveløya” (Devil’s Island). The Norwegian Meteorological Institute occupied the island on behalf of Norway in 1922, and it is the breeding area for many seabird populations on the boundary between the American and European continent.
Contact person: Hallvard Strøm, Norwegian Polar Institute
Migrations and habitat use
Large variation occurs in the seabirds’ use of habitat throughout the year. Studies showing how the seabirds use the marine habitats are therefore important in order to understand what regulates the occurrence of the different seabirds both temporally and spatially. For example, some species spread themselves out over large sea areas in the winter season, while others stay close to limited coastal areas. During the breeding season they have a limited radius of action around the colony, and therefore use smaller areas.
Populations at sea
On the open sea, beyond the outermost skerries, we find the pelagic seabirds. Pelagic seabirds migrate over large sea areas, and live mainly on shoaling fish, zooplankton and fish fry. In cooperation with the Institute of Marine Research, SEAPOP collects data on the distribution of seabirds on the open sea. We map their distribution patterns and habitats, and we study their role in the marine ecosystem.
Methods for mapping along the coast
Seabirds along the coast are mapped from three different platforms: From airplane/helicopter, boat, and from land. In addition, an array of different counting methods is used, including sampling sites, area calculations, transects, random point counts and stratified sampling. We have counted from pictures, with binoculars, and we have walked a lot. And not least, we have seen a lot!
Method for mapping on the open sea
Mapping seabird distribution on the open sea means to find out where the different bird species are at sea at different times of the year. It gives us an overview of where the birds’ most important habitats are. To discover this we need to be out on the sea counting birds – we need to go on mapping expeditions. Under the section Study areas, you can read about what areas, species and times of year we concentrate our work on. Here, we describe the method we use to count birds when we are on an expedition.
Methods for revealing migration and habitat use
One of SEAPOP’s goals is to increase our knowledge about seabird distribution and area use. Management of seabirds can be improved by identifying important key areas used both during and outside the breeding season, as well as understanding how the species cope with changes in the environment.
Monitoring methods
The foundation for all nature monitoring is the collection of time series data for different variables; this is also the case with the work we do to monitor the status of our seabird populations. A time series is created by measuring a variable regularly over time. But how do we proceed in order to get the data?
The seabird studies at sea – prioritized species, and spatial and temporal boundaries
To map all distributions of all seabirds in all sea areas at any given time is, in practice, an impossible task. It would require a system that we do not currently have the technology or resources for. Therefore, we have limited the work both spatially and temporally, while simultaneously choosing species that we believe are important to focus on.
Analysis of seabird data from the open sea
We use statistical analyses of count data to quantify the expected occurrence of seabirds in all-encompassing areas. First, we analyse the relationship between seabird occurrence and diverse geographical variables. This relationship is then used to calculate the expected, or predicted, seabird occurrence in all-encompassing areas. Here, we present a detailed description of the methodology we have used.
Monitoring population development in seabirds
Seabirds are good indicators that react early to changes in the marine environment. One of the simplest units of measurement for how seabirds react to changes is how the populations change from year to year. In Norway, the populations of breeding and overwintering seabirds have been monitored for over 30 years, and the longest time series have more than 50 years of data.
Population sizes of breeding seabirds
In Norway, populations of breeding seabirds have been monitored more or less regularly since the mid-1900s in a few colonies; it was first at the end of the 1970s that the monitoring was more systematically structured, and combined with studies of reproduction and diet choice for selected species through the so-called Seabird Project (1979-1984).
Population sizes of wintering seabirds
Population monitoring of wintering seabirds was started in certain areas in the mid-1970s, but first occurred on a nation-wide basis in 1980. This monitoring is conducted from the Swedish border in the south to Varanger Fjord in the north, with the following ten primary areas: Østfold, Vest-Agder, Rogaland, Smøla, Trondheim Fjord, Vega, Salten Fjord, Vesterålen, Troms and Varanger Fjord.
Population numbers at sea
Populations on the open sea are monitored from ships. When the coverage is approximately the same from year to year, we can estimate the number of birds and examine how abundance and distribution change over time.
Methods for calculating population sizes
Our calculations of seabird population sizes are based on data from the mapping of birds in the breeding season. We count the number of breeding pairs at a given breeding site and sum up the numbers for large areas. This type of mapping is demanding, and we normally only conduct it once per decade. Therefore, we use data from the nearest monitoring sites to adjust and update the population sizes for every breeding locality.
Monitoring seabird breeding success
To a large degree, the number of seabirds in a colony is determined by the survival rates of adults and their reproduction (production of young) rates (and hence the later recruitment of the young to the same colony). Immigration and emigration are normally limited because the seabirds exhibit high site fidelity, that is to say, that once they have established themselves as breeding birds in a colony they will normally stay connected to that colony for the rest of their lives.
Monitoring survival rates
Survival rate of adult seabirds is one of several parameters monitored by SEAPOP. Knowledge gained from this parameter is essential in order to understand the demographic mechanisms driving the seabirds’ population development.
Monitoring the seabirds’ diet
At the top of the marine food pyramid we find marine mammals and seabirds. Through evolution, seabirds have developed a long series of morphological and physiological adaptations which allow them to exploit the ocean’s resources in innumerable ways. The result is advantageous as it reduces competition between species, but specialisation also contributes towards increasing the seabirds’ vulnerability to changes in the available food.
Monitoring the time of breeding
For most organisms, good timing is absolutely crucial to success. This is especially the case when they invest in activities that are particularly energy demanding, such as breeding and moulting. The better these activities correspond to peaks in the occurrence of prey species, the lower the risk of high energy use, and consequently the lower the cost of achieving good breeding success. Timing the start of breeding well is an extra challenge, as birds’ energy needs are highest when feeding their young (which occurs many weeks after egg-laying), and the young are also dependent on having good access to food when they leave the colony.
Learn more about the seabird species SEAPOP monitors via species-specific descriptions, distribution maps and time series data!
Method for monitoring survival rate
In order to find the probability of a bird in a given population surviving from one year to the next, a lot of birds have to be captured and banded.
Method for monitoring reproduction
Method for monitoring population development
Breeding and wintering populations are monitored using internationally standardized methods described by, among others, Walsh et al. 1995, and translated to a simplified Norwegian version intended for a limited number of species by Follestad & Lorentsen in 2011 (PDF, 4.0 MB). The practical work is simply all about counting birds or nests.
The northern fulmar is very common at Spitsbergen and often feeds near the glaciers. Photo: Sébastien Descamps
Human activity
The largest settlement on Spitsbergen is Longyearbyen (around 2000 inhabitants), followed by Barentsburg, a Russian settlement with 500 inhabitants. Ny-Ålesund in Kongsfjorden and the Polish research station in Hornsund are two settlements dedicated to research activities. Numbers of researchers vary from ten in the winter in Hornsund to almost 200 people in the summer in Ny-Ålesund. The mining community at Svea in the Van Mijenfjord is the third largest in Svalbard with about 300 workers.
Longyearbyen is the largest settlement on Svalbard. Photo: Sébastien Descamps
Fieldwork
SEAPOP fieldwork in Isfjorden and Kongsfjorden is from early June to early August. There is usually one team of 2-4 people in each fjord, with their main bases in Longyearbyen and Ny-Ålesund, respectively. They make daily trips to the colonies, mainly by means of a small boat. Fieldwork at Alkefjellet usually lasts one week, at the end of June, and this colony is visited by a team of four people. The most common tasks at all sites are counting birds within set plots, catching and ringing birds, looking for colour-ringed birds, monitoring nests and registering prey items brought to the chicks by the parents. Loggers (GPS or GLS) are also mounted on birds in some colonies.
Map of the SEAPOP sites used in monitoring the various species at Spitsbergen. Map: Sébastien DescampsGood and reliable safety equipment are required when Brünnich’s guillemots and kittiwakes are to be caught in the steep cliffs. Photo: Sébastien Descamps