Seabirds at sea
Our distribution maps give you a quantitative overview of the seabirds’ occurrences on the open sea at different times of the year. Choose between the 12 different species in the table and download maps (PDF) or specify your search by distribution data in the data portal! You can also read about the datasets that serve as the foundation for the development of the maps.
Species that are included in the analyses:
| English | Latin | Download map |
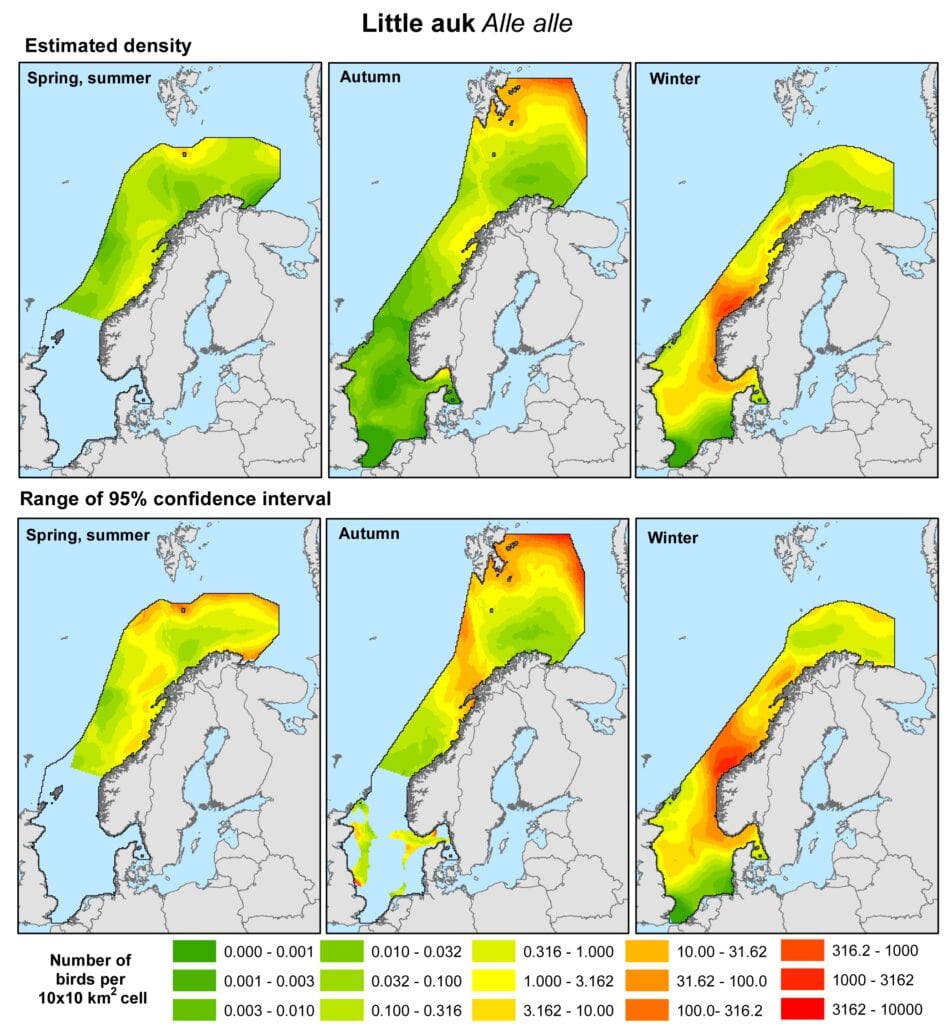
| Little auk | Alle alle | PDF (2.9 MB) |
| Atlantic puffin | Fratercula arctica | PDF (3,0 MB) |
| Razorbill | Alca torda | PDF (3.0 MB) |
| Brünnich’s guillemot | Uria lomvia | PDF (2.5 MB) |
| Common guillemot | Uria aalge | PDF (3.0 MB) |
| Northern fulmar | Fulmarus glacialis | PDF (3.0 MB) |
| Black-legged kittiwake | Rissa tridactyla | PDF (3.0 MB) |
| Common gull | Larus canus | PDF (2.3 MB) |
| Herring gull | Larus argentatus | PDF (2.9 MB) |
| Black-backed gull | Larus marinus | PDF (3.0 MB) |
| Glaucous gull | Larus hyperboreus | PDF (2.6 MB) |
| Northern gannet | Morus bassanus | PDF (2.9 MB) |
Certain species are excluded from seasons and sea areas where they were too few in number for the analyses to be conducted.
You can also retrieve maps on the distribution of seabirds on the open sea in the data portal:
• Under “Tidsperiode”, choose season (Sommer = summer, Vinter = winter or Myting/Høst = moult/autumn).
• Under “Geografisk utvalg”, choose sea area.
• Then choose the desired species under “Artsvalg”.
• Then click “Åpent hav data” at the bottom.
About the maps
There are three maps for each species – one for each of the seasons. The maps are made up of 10×10 km2 grids, and show predicted abundance for the species in question based on two-step analyses (see Data analysis) of available distribution data of seabirds in Norwegian and adjacent sea areas. We also present, together with the maps, the uncertainty of the predictions as 95% confidence interval and standard error. It was not possible to define the confidence intervals for very low densities. It is therefore important to note that the uncertainty does not account for systematic errors resulting from differences in detection (see Methods). Conspicuous species that easily follow vessels are systematically overestimated. This is particularly the case for such species as the northern fulmar, black-legged kittiwake, European herring gull, great black-backed gull and common gull. Small, dark species that dive are probably similarly underestimated. This is particularly the case for the auks: the little auk, Atlantic puffin, razorbill, Brünnich’s guillemot and common guillemot. Therefore, the abundance estimates must be treated as indices.
Each sea area (the North Sea, Norwegian Sea and Barents Sea) is separately analysed. This results in some discontinuity in the border areas between sea areas.
The seasons analysed are:
- Summer: April 1 – July 31
- Autumn: August 1 – October 31
- Winter: November 1 – March 31
Please note: SEAPOP maintains the copyright to all generated maps, and SEAPOP must be cited in the case of any reuse of these maps.
About the datasets
In the datasets, XUTM and YUTM represent the midpoint in each 10×10 km2 cell, given as UTM coordinates in zone 33. “Ocean” denotes sea area: NO = North Sea, NW = Norwegian Sea, BS = Barents Sea. The expected number of birds for each species is given for each 10×10 km2 cell.
Estimates for each species are given with species code in the next 12 columns. Next, the results from the “bootstrap” analyses for each individual species are given, where mXXXXX = average log10-transformed “bootstrap” estimates, seXXXXX = standard error of log10-transformed “bootstrap” estimates, ci025XXX = lower boundary for the 95 % confidence interval, ci975XXXXX = upper boundary for the 95% confidence interval, and CIXXXXX = size (range) of the 95% confidence interval.
Missing estimates are denoted as -999.
Please note: SEAPOP maintains the copyright to the datasets, and SEAPOP must be cited in the case of eventual reuse of the datasets.