Method for mapping seabirds on the open sea
Mapping seabird distribution on the open sea means to find out where the different bird species are at sea at different times of the year. It gives us an overview of where the birds’ most important habitats are. To discover this we need to be out on the sea counting birds – we need to go on mapping expeditions. Under the section Study areas, you can read about what areas, species and times of year we concentrate our work on. Here, we describe the method we use to count birds when we are on an expedition.
See maps and data on seabird distribution
Observational methodology
Graphics: SEAPOP
The goal of the mapping expedition is to collect data that allows us to calculate the density of birds on the sea, that is to say, the number of birds per unit of area – for example, square kilometre. The data is collected with the help of the strip transect method. The observer usually stands on the bridge of a research vessel, ca. 8-10 m above the sea surface. While the ship sails forward in a straight line (line of sight) with a constant speed, the observer counts all seabirds within a defined sector. The sector has a radius of 300 metres and is defined by a 90 degree angle between the line of sight and an imagined line out to one side of the ship. Seabirds are classified to species or family, and it is noted whether the bird was flying or sitting on the surface of the water. Observations are only made under good observational conditions. That is to say, the observational conditions must be such that there is a high probability that a bird will be detected within a radius of 300 m.
Some species actively follow the vessel (ship-followers), and will therefore be overestimated when using the strip transect method. In our waters, this is the case with all gull species and the northern fulmar. In a number of cases, these species will be counted with the help of regularly spaced point counts. Point counts and strip counts give different estimates of density, and when performing analyses, these methods are differentiated from each other by including different methodology as a factor.
Sources of error
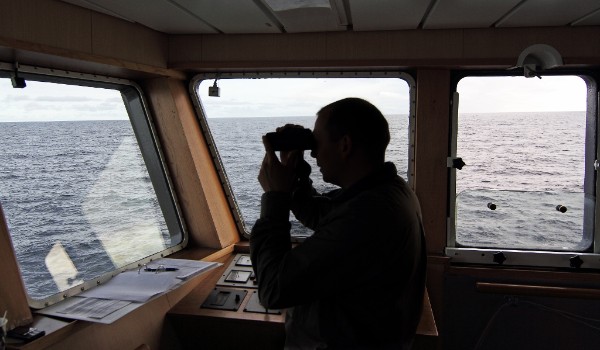
Photo: Thomas de Lange Wenneck
Assuming that counting has been conducted without error, the strip transect method allows for the estimation of bird density within the strip that was followed. However, there are many sources of error with this method, and many of these sources of error cannot readily be estimated or corrected for.
The method assumes that the birds remain calm in relation to the ship’s movement, so that the same bird is not counted several times. This is not the case, as birds are almost constantly in some form of movement. Further, it is assumed that all birds have an equal probability of being detected. However, this is not the case either, first and foremost because different birds can have very different behaviours and appearances. Birds that move a lot, as a consequence of migration or the way in which they forage, have a higher probability of being detected and counted. Large birds with colours that are easy to tell apart from the surroundings will be easier to detect than small and well-camouflaged species. Birds actively responding to the vessel also leads to sources of error. Birds that actively follow the vessel have a higher probability of being counted several times, while those that actively avoid the vessel by diving, flying, or swimming away have a smaller probability of being found within the sector.
The significance of sources of error
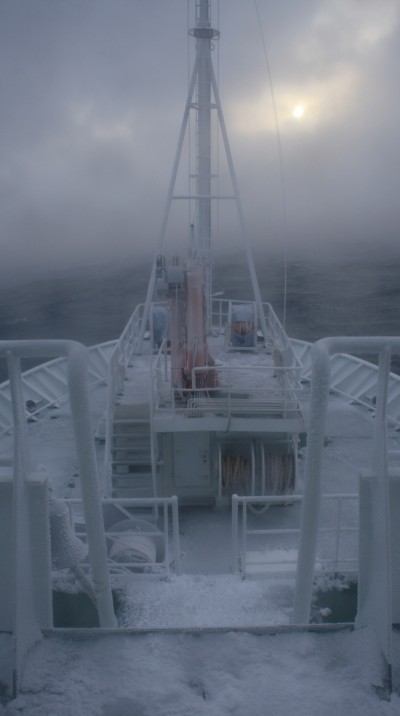
Photo: Stuart Murray
The above-mentioned sources of error are considerable, and without taking them into consideration it will not be possible to get a real estimate for the abundance or density of a given species. It is important to note that, to a large extent, the sources of error are associated with species-specific differences, that is to say, special characteristics that vary between the species. This means that one must be careful with comparing estimates of density across different species. Specifically, large, light-coloured, surface-feeding species that follow boats will systematically be overestimated. In our waters, this primarily relates to all gull species and the northern fulmar. Conversely, small, dark species that dive will be systematically underestimated, and in Norway this primarily relates to small auks. The sources of error, however, will not vary so much between seasons, years, or sea areas. Therefore, one can assume that the relative differences noted between years, sea areas, or seasons for a given species are real differences, and are not tied to this type of source of error.
In contrast to the species-specific sources of error, sources of error that are tied to the collection of data can, in many cases, be controlled for and/or estimated. This applies to sources of error tied to observational conditions (weather and visibility), different vessels, different observers and distance to the birds being observed. In many cases, it will be difficult to separate the effects from each other because there is a complete overlap between e.g., observer and year/season/sea area, or between observer and vessel. In addition, there have been different practices as far as noting down the different factors, and large portions of data would have had to have been discarded if these sources of error were to be taken into account in the analyses. The strip transect method is, however, a relatively simple method, which reduces the differences between observers, vessels and observational conditions. We therefore assume that the sources of error tied to observational conditions are small, and randomly distributed between sea areas, years and seasons.
Read more about the analysis of data from the bird counts on the open sea.