The SEATRACK web app has been updated
We now have loggerdata from 2 721 individuals of 11 seabird species available for viewing in the SEATRACK web application.
The SEATRACK web-application has now been updated with data gleaned from loggers retrieved in 2018. This is the last large-scale update from the first project phase, which started in 2014 and ended in 2018. The web application was launched in early 2017 and currently displays seasonal distribution kernels based on 1 625 885 filtered positions (4 825 annual tracks) from 2 721 individuals of 11 species from 82 populations (36 locations) breeding around the North East Atlantic.
The SEATRACKs web-app is located on the SEAPOP web site. There you can choose species, colonies, seasons and years that you would like to view position data for. You can compare areas used by different populations at any given time in the same map. Data from older studies are also available in the map application. It is not possible to download the maps but if you wish to utilize data from SEATRACK you are welcome to contact the SEATRACK project.
Contact person: Hallvard Strøm, Norwegian Polar Institute
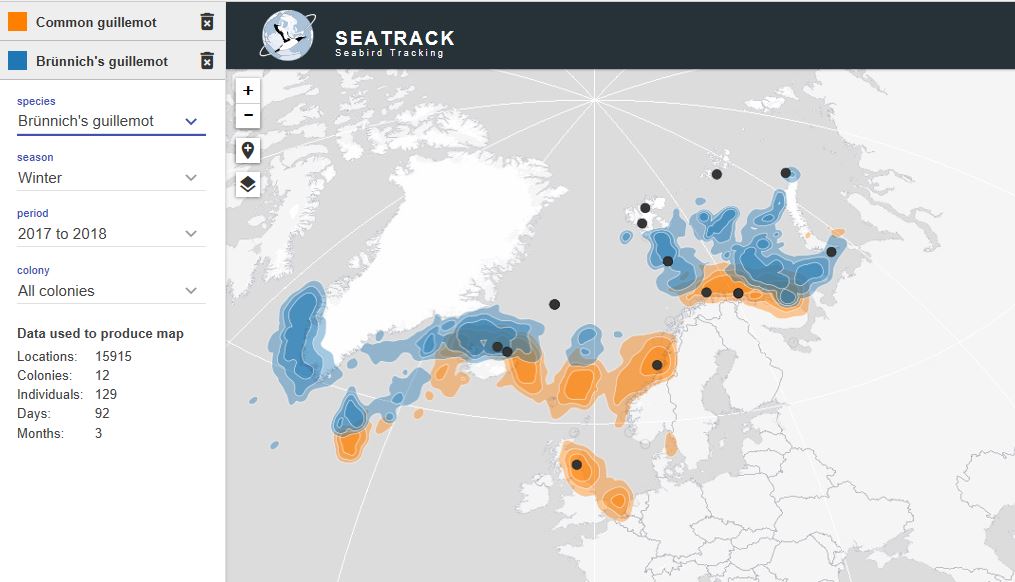
Illustration: SEATRACK