How to use the data portal
This page gives an overview of the options to choose from when creating searches in SEAPOP's portal for maps and data. The data portal is in Norwegian language only, but you will find translations and explanations to all menu items below, with Norwegian terms written in italic. Selections are made on the lefthand side once you've entered the data portal.
Types of data: distribution data and time series data
Starting at the top of the menu, you select which type of data you want to view under “Velg datatype“.
To view distribution data, choose “Fordeling av sjøfugl“. Under this category, you will have three options:
- Siste observasjon – gives the number of birds at the most recent count. By selecting “Kommunfordelt“, you will be able to see how the number of birds is distributed in different municipalities.
- Høyeste antall – the highest numbers ever registrert at the location(s).
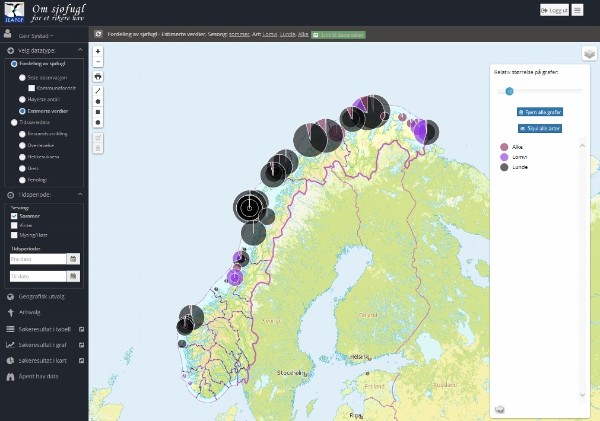
- Estimerte verdier – estimated values; reported for breeding paris only, these values are calculated on the basis of the expected development at locations not counted annually, based on numbers form the nearest monitoring site. Not all species are monitored, and in some areas the distance to the nearest monitoring site is too long for this to be sensible. In such cases, no estimate is given for this species/location.
To view time series data, select “Tidsseriedata“. Under this category, you will have the following five options:
- Bestandsutvikling – changes in population sizes.
- Overlevelse – annual survival rate of adult birds.
- Hekkesuksess – breeding success denoted as poor (D), average (M) or good (G).
- Diett – food items chosen by the seabirds.
- Fenologi – phenology – timing of hatching.
Time period
Under “Tidsperiode“, you may choose to view data by season (Sesong) or in a period between specific dates (Tidsperiode). The seasons are summer (sommer), autumn (høst) and winter (vinter), but because time series data are only collected in the summer, selecting season will only make sense when looking at distribution data. Selecting winter or autumn as season for a type of time series data, e.g. breeding success, will thus still present results based on data from the summer.
Geographic selection
Clicking “Geografisk utvalg” will present you with a menu giving you the option to confine your search geographically. You can choose to see data by municipality or county, for different protected areas and maritime zones, or you can select specific locations. Press and hold the Ctrl key for multiple selection.
Species, sex and age
Under “Arstvalg“, you select the species in question (use the Ctrl key for multiple selection). You may also filter your search by sex (kjønn) and age (alder) where relevant data exist.
Terms:
Ukjent – unknown
Hanner – males
Hunner – females
Hunnfarget – female plumage
Pull – chick
Ungfugl – young bird
Voksen – adult
Presentation
Finally, you must choose the presentation form for the data by selecting either
- Søkeresultat i tabell – table,
- Søkeresultat i graf – graph or
- Søkeresultat i kart – map