About SEATRACK
Before the relatively recent emergence of light-logging technology, tracking the movements of seabirds throughout the year was very difficult, for some species, close to impossible and extremely expensive. As a result, we knew little about which ocean regions the different species inhabit outside the breeding season. Now, with a combined effort of researchers all around the North-East Atlantic participating in SEATRACK, light-logging technology has enabled mapping of important seabird wintering areas and migration routes on a much larger scale and in greater detail than ever before, yielding new and important information needed for the management of seabirds in North-Atlantic waters.
Study aims
The countries party to SEATRACK host large and internationally important populations of several seabird species, many of which have experienced negative population trends over recent decades. Many seabird species are spread over vast oceanic areas for most of the year and only aggregate on land during the breeding season. Consequently, little is known about many aspects of their life away from the breeding grounds leaving large gaps in our knowledge and understanding of seabird life-histories.
Development of small and lightweight instruments, so-called light-logger or GLS (global location sensor) technology has now provided scientists with the means to monitor bird movements throughout the year on a much greater scale than before. The loggers primarily record light levels which, in relation to time of year and day, can be used to calculate twice daily positions of an individual within a radius of approximately 180 km. SEATRACK is utilizing the full potential of light-logger technology with a large-scale coordinated and targeted effort encompassing a representative choice of species, colonies and sample sizes. Such data will help researchers to identify:
- The most important moulting areas, migration routes and wintering areas for different seabird populations.
- The size and the composition of seabird populations during the non-breeding season.
- What environmental threats the different populations face.
- The origin of birds (i.e. the breeding population) that will be affected in acute incidents such as oil spills, mass mortality due to starvation or drowning in fishing gear.
- The different environmental conditions characterizing the different habitats occupied by Norwegian seabirds, how these change over time, and how they are reflected in the population dynamics and demography in the colonies
- Responses to climate change and how this affects the different populations.
Seabird migration patterns and non-breeding distribution have repeatedly been highlighted, by several social sectors as being some of the most important knowledge gaps, needed to be filled for effective management of seabird populations. SEATRACK intends to provide that information by producing:
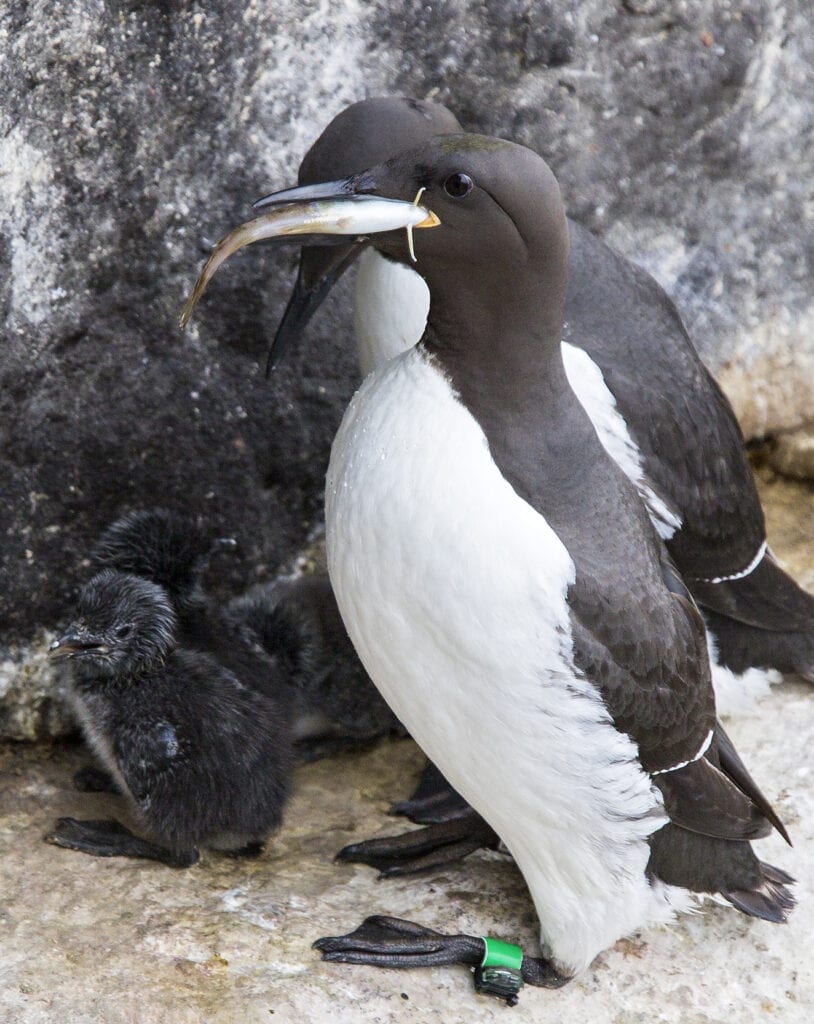
Photo: Yann Kolbeinsson
- Distribution maps and population origin maps. Documenting the area use during the non-breeding season, including moulting areas, migration routes and wintering areas for different seabird populations over a three-year period. Estimating the size and the composition/colony origin of populations during the non-breeding season.
- Research articles about I) variation in migration strategies and the environmental factors underlying this variation, II) migration strategies and seabird demography/population dynamics, III) seabird migration strategies, human activities and marine spatial planning
Study setup
The SEATRACK project was formally launched in spring 2014. The study area encompasses 56 study sites encircling the Labrador, Greenland, Barents, Norwegian, North and Irish Seas, which includes colonies in Canada, Greenland, Russia, Norway incl. Svalbard and Jan Mayen, Iceland, the Faroe Islands, Ireland and United Kingdom.
Eleven species were selected as focal species, representing four ecological groups, i.e. pelagic divers, pelagic surface feeders, coastal surface feeders and coastal divers. To document the variation in habitat use across ocean regions, priority has been given to two species with a breeding range spanning the whole study area: black-legged kittiwake and common guillemot. In addition, species characteristic for a given region and feeding guild, found breeding in colonies that are accessible and in large enough numbers to supply a sufficient sample size were chosen. Selecting study sites, priority was given to colonies representative for the distribution range of a given species. Emphasis was also placed on working within colonies where seabird research had already been established, thus providing the possibility of combining GLS data with other research as well as simplifying logistics and reducing costs considerably.
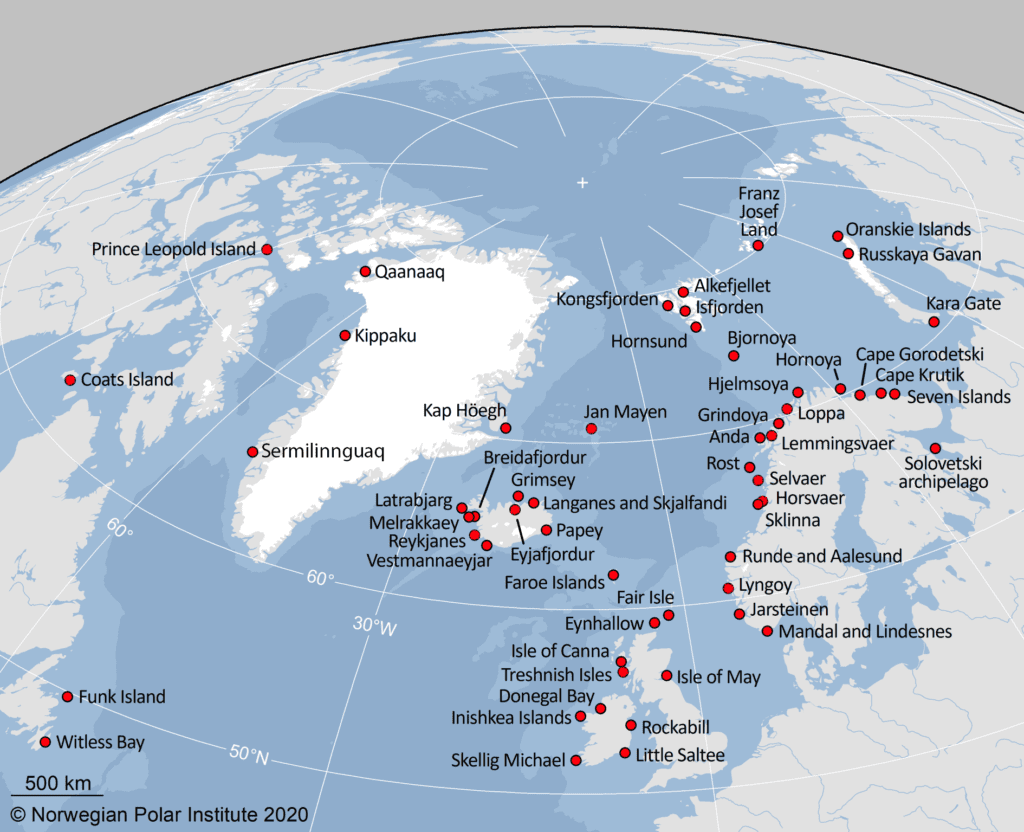
Map: Norsk Polarinstitutt
Light logger technology
SEATRACK utilizes light-loggers (also known as GLS loggers, global location sensors or geolocators); small, lightweight and relatively cheap devices that are easily attached to a leg-band with cable-ties and glue. Such a logger is typically made up of a five components; a light sensor, an internal clock, a memory chip, a battery and connection pins, all encapsulated in an epoxy shell. The sensor measures light intensity every minute and stores the maximum light level every 5 or 10 minutes. The connection pins, primarily used for downloading data and programming sampling regimes, can also register whether the logger is submerged in water or not, thus providing information concerning the activity of the bird. Some loggers also measure water temperature when submerged. Models vary with respect to weight (1-2.5 g), size (height 15-20 mm, width 9-14 mm) and battery capacity (1-5 years). The smallest models are most suitable for the smallest species, but have more limited battery capacity.

Photo: Hálfdán Helgason
By recording light-levels, the time of sunrise and sunset can be determined which in turn is a proxy of the longitude the logger is at, while the duration of day/night provides information about latitude. Other parameters recorded by the logger, such as water temperatures can then provide information that increases the accuracy of the estimated positions.
GLS loggers have been successfully deployed on a wide range of species from thrushes to albatrosses, including all 11 species currently included in SEATRACK. Many participants in the project have several years of experience using the technology, and all are experienced in a variety of methods, trapping and handling wild birds. The low weight of the loggers (<1 % of the body weight) combined with specially adapted mounting rings minimise any impact on the birds behaviour and condition, e.g. the bird can still withdraw its feet into its plumage and extra flight costs are expected to be minimal. Swimming and diving may, however, be potentially affected. That being said, there are currently no indications of such impacts on seabirds,despite these methods having been tried and tested for several years on small diving species such as little auks.
The main drawbacks of GLS technology are that the bird must be recaptured to download the data and the relatively low precision of the positioning (ca. 180 km). Furthermore accuracy of positions gleaned using only the light intensity data is severely reduced during certain periods of the year, e.g. during the equinox periods and during periods of continuous light (midnight sun) or darkness (polar night).
The SEATRACK web-application
The SEATRACK web-application is intended to provide open access to the project’s results in a manner that is simple to use and understand.
The application allows users to select results for different species, years, seasons, and colonies and display them on a map. The maps depict kernel distributions or probability density functions overlaid over all available data points that are based on the selection criteria. The polygons displayed represent, with increasing colour intensity, the 25%, 50% and 75% probability contours of these functions. In other words, the maps display the likelihood of birds within a given selection being in the area given the data available.
The application allows for comparison of up to eight selections displaying the different distributions in differently colored polygons on the map. To add a new selection with different criteria use the red “plus” button in the bottom right corner of the selection bar and another kernel layer is added to the map. Information about the selection, such as the number of valid individual locations, number of colonies, individuals, days included in the selection is shown on the bottom of selection bar to the left of the map. Maps displaying several seasons (i.e. “all seasons”) and/or several colonies (i.e. “all colonies”) are composites of included individual seasons and/or colonies with data.

Figure: http://seatrack.seapop.no/diversitymap/
Project organization and funding
SEATRACK is led by a project-group with representatives from the Norwegian Polar Institute (NPI) and the Norwegian Institute for Nature Research (NINA).
- Hallvard Strøm – PI, Project group (NPI)
- Sébastien Descamps – Project group (NPI)
- Børge Moe – Project group (NINA)
- Per Fauchald – Project group (NINA)
- Arnaud Tarroux – Project group (NINA)
- Svenja Neumann – Project coordinator (NPI)
- Benjamin Merkel – Project group (NPI)
- Vegard Sandøy Bråthen – Project technician (NINA)
- Caitlin Frankish – Postdoc (NPI)
SEATRACK’s funders are the Norwegian Ministry of Climate and Environment, the Norwegian Ministry of Energy, the Norwegian Environmental Agency, the Norwegian Coastal Administration, and Offshore Norge along with 16 energy companies (Equinor, WintershallDea, AkerBP, Total, Shell, OKEA, Sval, Neptune, Vår, ConocoPhillips, Vårgrønn, Fred. Olsen Seawind, Hafslund Vekst, Ørsted Norge, NorSea Group and Statkraft).